
An SEO performance dashboard is a centralized, visual tool that pulls all your key SEO metrics into one easy-to-digest interface. Think of it as a command center for your website's search engine visibility. It takes complex, scattered data and turns it into clear, actionable insights you can actually use for strategic decisions.

Trying to manage modern SEO without a dashboard is like trying to fly a jumbo jet without the cockpit instruments. Sure, you're moving, but you're operating on pure instinct, not real-time data. You're surrounded by a flood of information from tools like Google Analytics, Search Console, and a dozen other platforms, but it’s all disjointed and overwhelming.
An SEO performance dashboard cuts right through that chaos. It’s like a vital signs monitor for your website's health, translating streams of raw numbers into a clear story. Instead of drowning in spreadsheets, you get an immediate snapshot of what’s working, what isn’t, and where your next big growth opportunity is hiding.
This shift—from guesswork to a truly informed strategy—is where a good dashboard proves its worth. It gives you the clarity to answer critical questions fast. Are your latest blog posts actually driving more organic traffic? Is that sudden drop in rankings a technical glitch or a competitor making a move? Which keywords are bringing in high-value visitors? A dashboard puts these answers right at your fingertips.
This immediate access to performance data is more critical than ever. Why? Because organic search is still the king of user acquisition. The data doesn't lie: around 53% of all website traffic comes directly from organic search. And with Google processing over 99,000 searches every single second, the need for real-time monitoring becomes painfully obvious. You can find more stats on the power of organic search over at AIOSEO.com.
A great dashboard doesn't just report on what happened yesterday; it gives you the intelligence to shape what happens tomorrow. It’s the difference between reacting to problems and proactively seizing opportunities.
To really nail this down, let's look at the core advantages you get from implementing a centralized SEO dashboard.
A well-designed dashboard isn't just about convenience; it’s about making smarter, faster decisions that directly impact your growth. Here’s a quick summary of what you gain.
BenefitImpact on Your StrategyHolistic ViewBreaks down data silos by combining metrics from analytics, rankings, and backlinks into a single, unified view.Time EfficiencyAutomates data collection, freeing up your team's time for high-value analysis and strategic execution.Improved CommunicationMakes it easy to show performance and ROI to stakeholders or clients with clear, visual charts and KPIs.Faster Problem-SolvingHelps you spot negative trends or technical issues (like indexing failures) almost instantly, before they cause real damage.
Ultimately, these benefits work together to create a more agile and effective SEO program. You're no longer just collecting data—you're using it to drive meaningful results.
A dashboard is only as good as the data it shows. Fill it with cluttered, irrelevant numbers—what we call "vanity metrics"—and you've got something that's more distracting than helpful. To build a true command center for your SEO, you have to focus on the key performance indicators (KPIs) that directly signal the health and success of your strategy.
It's all about cutting through the noise.
We can do this by grouping the most critical KPIs into four pillars of success: Visibility, Traffic, Engagement, and Conversion. Think of them as a sequence. Better Visibility (showing up in search results) drives more Traffic (people visiting your site). Great content creates positive Engagement (users interacting with your pages), which ultimately leads to Conversion (achieving your business goals).
Let's break down what belongs in each pillar.
This diagram shows the core metrics that form the foundation of a strong SEO performance dashboard.
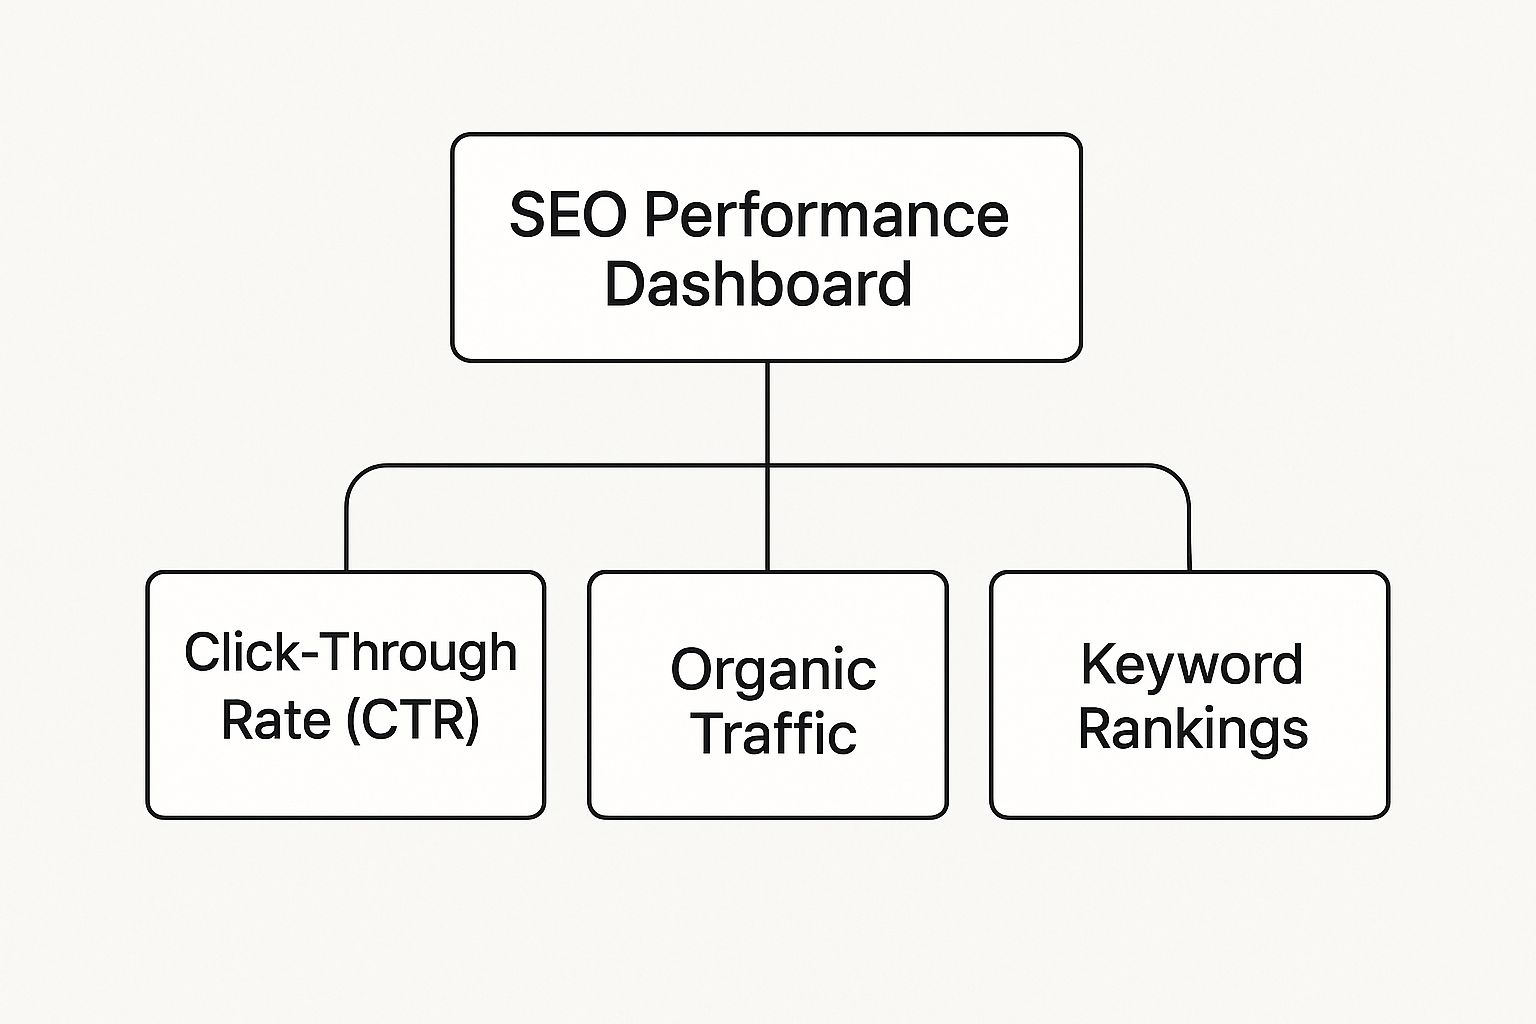
As you can see, organic traffic, keyword rankings, and CTR are all interconnected, supporting your entire SEO structure.
Visibility metrics tell you one simple thing: how often people see you on the search engine results pages (SERPs). If users can't find you, none of the other metrics matter. It’s step one.
Once you're visible, the next challenge is getting users to click and then keeping them interested. These next two pillars measure exactly that.
Organic Traffic is the lifeblood of SEO. It’s the number of visitors who land on your site from unpaid search results, and it's the direct payoff for strong visibility. A steady increase in organic sessions is one of the clearest signs that your campaign is working.
Engagement Metrics, on the other hand, tell you what people do after they arrive. They're powerful clues about your content quality and user experience. The main ones to watch are:
This focus on user experience is now at the heart of how search engines operate. Modern SEO dashboards have to reflect this, moving beyond just traffic and rankings. To truly get a handle on your performance, it's essential to grasp the broader context of digital marketing metrics. You can learn more by understanding key digital marketing performance metrics that shape your overall strategy.
This is where your SEO efforts connect directly to real business outcomes. Conversion metrics track whether your hard-earned organic traffic is actually taking the actions you want them to.
The evolution of these dashboards is also heavily influenced by Google's E-E-A-T framework (Experience, Expertise, Authoritativeness, Trustworthiness). And with 92.3% of users now browsing the internet on mobile devices, it's absolutely critical that your dashboard includes mobile-specific analytics to get the full picture.

Relying on a generic, out-of-the-box dashboard is like using a one-size-fits-all wrench on a specialized machine. It might get the job done, but it’s clumsy and misses the nuances. To get real, actionable insights, you need a custom SEO dashboard built around your specific business goals.
This isn’t just about making pretty charts; it’s about transforming a simple reporting tool into a strategic command center.
The very first step—before you even think about tools or metrics—is to ask yourself the most important question: “What are we actually trying to achieve with SEO?”
Is the goal to generate leads for your B2B software? Drive online sales for an e-commerce brand? Or is it to build brand awareness in a new market? Your answer changes everything.
Once you know the why, you can define the what. A broad goal like "generate more leads" gets translated into tangible Key Performance Indicators (KPIs) you can actually measure, like Organic Form Submissions, Click-to-Call Rate from SERPs, or New Contact Conversion Rate. This clarity ensures every single metric on your dashboard serves a purpose.
With your goals and KPIs locked in, it's time to pick the right platform to bring your vision to life. There are several great options out there, and the best one for you hinges on your budget, technical skills, and how deep you need to go with your data.
Here’s a look at the most popular choices:
ToolProsConsIdeal ForGoogle Looker StudioIt's 100% free and connects perfectly with Google products (GA4, GSC). Highly customizable.Can get sluggish with huge datasets. Non-Google connections often require paid third-party connectors.Businesses of all sizes, especially those already deep in the Google ecosystem.DataboxSuper user-friendly with beautiful pre-built templates. Great mobile app for checking stats on the go.The free plan is quite limited. Costs can add up quickly as you connect more data sources.Agencies and marketing teams who need to create sharp-looking client reports without a lot of fuss.KlipfolioIncredibly powerful and flexible. It can handle complex data modeling and custom calculations.Has a much steeper learning curve and can be pricier than the other options.Data-heavy teams and large companies that need deep customization and advanced analytics.
A dashboard is only as good as the data flowing into it. The whole point is to create a single source of truth by pulling all your critical SEO data into one place, saving you from bouncing between a half-dozen different platforms.
At a minimum, you'll need to connect these core data sources:
A dashboard that only shows past performance is a history book. A dashboard that integrates real-time data sources becomes a playbook for the future, allowing you to react instantly to opportunities and threats.
By connecting these sources, you start to see the full picture. You can overlay GSC impression data with GA4 organic traffic to see exactly how a drop in rankings impacts your bottom line. This holistic view is the true power of a custom dashboard—it turns scattered data points into a clear, actionable strategy.
If you're only tracking your own progress, you're missing half the picture. An SEO performance dashboard that only looks inward is like a runner training on a track with no clock and no other athletes—sure, you know you're moving, but you have no idea if you're fast enough to actually win the race. To truly understand your place in the market, you have to benchmark your success against the competition.
This is where your dashboard goes from a simple report card to a strategic weapon. By dedicating a section to competitive intelligence, you transform it from a self-assessment tool into a live map of the entire battlefield. It's how you spot weaknesses, identify strategic gaps, and pounce on opportunities your rivals are completely overlooking.
Imagine discovering your main competitor is sitting at #3 for a high-value keyword, but their content is thin, outdated, and frankly, a bit lazy. That isn't just a data point; it's a glaring, neon sign telling you to create a superior piece of content and snatch that ranking away. Without competitive benchmarking, that opportunity would have stayed hidden in plain sight.
Before you can start outmaneuvering your rivals, you need a brutally honest assessment of where you stand. A competitive benchmarking module in your dashboard gives you exactly that—a clear, side-by-side comparison across the metrics that truly matter. This data-first approach strips away emotion and wishful thinking, replacing them with a clear-eyed view of reality.
Here are the core metrics you absolutely must track for both your site and your top competitors:
One of the most critical aspects of an SEO performance dashboard is its role in benchmarking efforts against industry standards. It's not just about basic tracking; it involves gathering deep data on KPIs like organic traffic, keyword rankings, and technical health to set realistic targets. Discover more insights on how to benchmark your SEO performance for 2025 at Search Engine Land.
Setting up a dedicated competitor-tracking widget or section in your dashboard is surprisingly straightforward. Most modern dashboard tools can pull data directly from platforms like Ahrefs or Semrush, which are overflowing with competitive intelligence. From there, you just need to configure a few charts and tables to bring the data to life.
For example, a simple table comparing your domain authority against three key competitors gives you an instant snapshot of your site's relative strength. A line chart tracking your ranking versus theirs for a "shared" high-value keyword can show you who is gaining momentum over time.
To make this crystal clear, here’s a look at what a basic competitor benchmarking table in your dashboard might include:
MetricWhy It's Important for BenchmarkingTools to UseOrganic KeywordsShows the size of their keyword footprint. Are they targeting a broader or more focused set of terms?Semrush, AhrefsOrganic Traffic ValueEstimates the monthly cost of their organic traffic if paid via PPC. A high value indicates they rank for lucrative keywords.AhrefsReferring DomainsA direct measure of link authority. Are they earning links from a wider variety of quality sites?Ahrefs, Moz, SemrushTop Pages by TrafficReveals their content "home runs." This tells you what topics and formats are working for them right now.Semrush, AhrefsKeyword GapHighlights valuable keywords they rank for that you don't, giving you a ready-made list of content ideas.Semrush, Ahrefs
While analyzing these competitor metrics is fundamental, it all falls apart if your own technical foundation is shaky. An unoptimized site can't compete, no matter how sharp your strategy is; understanding crawl budget optimization is crucial for this reason.
By consistently keeping an eye on these comparative metrics, you shift from being reactive to proactive. You’ll no longer be caught off guard by a competitor's sudden surge in the SERPs because you will have seen the leading indicators—like their increased backlink velocity or a new content push—weeks in advance. That kind of foresight is what separates the good SEOs from the great ones.
A dashboard cluttered with charts that don't lead to action is nothing more than a digital paperweight. It might look impressive, sure, but it fails at its one true job: to drive results. The real magic of an SEO performance dashboard isn't just showing you what happened last month—it's about turning that historical data into smart, forward-looking decisions. It shouldn't be a history report. It needs to be a command center.
This is all about shifting from a reactive to a proactive mindset. A reactive dashboard tells you organic traffic dropped last week. Thanks, Captain Obvious. A proactive dashboard, on the other hand, gives you the real-time alerts and insights to stop that drop from ever happening. And that's where integrating specialized, real-time monitoring tools becomes a total game-changer.
Think of it like this: your standard metrics (traffic, rankings, conversions) are the speedometer and fuel gauge in your car. They tell you how fast you're going and if you're about to run out of gas. But real-time technical monitoring? That's the engine diagnostic light, warning you of a critical problem before you end up stranded on the side of the highway.
The biggest, and most-often-ignored, blind spot in most SEO strategies is indexing health. You can have the best content on the planet and a keyword strategy sharp enough to cut glass, but if Google can't find or process your pages, you're invisible. All that effort just vanished into a digital black hole.
This is where a generic dashboard completely misses the mark, because it only reports on what's already visible to search engines. Integrating a specialized tool like IndexPilot flips the script, transforming your dashboard from a simple reporting tool into a vigilant, proactive asset. By adding a real-time "Indexing Health" module, you gain an immediate window into the very foundation of your SEO performance.
An effective SEO performance dashboard doesn't just show you data; it asks questions. The most important question it can answer is, "Is my content actually live and visible on Google right now?" Without a confident 'yes,' every other metric is built on a shaky foundation.
This module fundamentally changes how you work. No more waiting days or weeks for Google Search Console to catch up. You know instantly whether that new blog post or critical page update made it into Google's index. This turns a slow, forensic investigation into an immediate, actionable task.
So what does this look like in practice? An Indexing Health module should give you at-a-glance answers to critical questions, turning raw data into clear, actionable steps. After all, a dashboard should empower you to take action, and once you know your pages are visible, finding profitable keywords that convert is a logical next step driven by those insights.
Here’s what this kind of real-time monitoring actually lets you do:
By adding this layer of real-time intelligence, your SEO performance dashboard evolves. It becomes more than a collection of KPIs; it’s a living system that actively protects your most valuable digital assets and ensures all your hard work translates into real, measurable growth.
Even the most sophisticated SEO performance dashboard can quickly become useless if you fall into a few common traps. It’s a familiar story: a team builds a dashboard with the best intentions, only for it to create more confusion than clarity.
By steering clear of these pitfalls, you can make sure your dashboard remains a powerful strategic tool, not just a collection of charts.
The most common mistake by far is “data dumping.” This is what happens when you cram every single metric you can think of onto one screen. Instead of providing clear, actionable insights, you end up with a cluttered mess that causes analysis paralysis. When everything is highlighted, nothing is.
Another classic blunder is obsessing over vanity metrics. It feels great to see a huge number of impressions or a spike in page views, but these figures often mean very little on their own. An effective dashboard cuts through the noise and focuses on what actually drives the business forward—like organic conversion rates or leads from specific non-branded keywords.
A dashboard that treats all your data the same is fundamentally broken. Failing to segment your information is a massive oversight because it completely hides the real story behind your performance. For instance, if you lump all your organic traffic together, you're mixing apples and oranges.
Think about it: a user searching for your brand name has a totally different intent than someone searching for a problem your product solves. Separating branded from non-branded traffic instantly reveals:
Getting this level of detail is non-negotiable if you want to make smart decisions.
A dashboard is not a static, one-and-done report. It should be a living document that grows and changes alongside your business priorities and SEO strategy. If your goals shift, your dashboard must shift with them.
Finally, one of the simplest yet most damaging mistakes is having a technical blind spot. Your dashboard could be showing green lights everywhere, but if you aren't tracking foundational health, you could be missing critical indexing problems that are poisoning your entire strategy. For example, submitting a sitemap to Google is SEO 101, and your dashboard absolutely should reflect its status.
If you ignore these basic building blocks, your data might be telling you a dangerously incomplete story.
Even with the best tools and a clear plan, questions always pop up. Let's tackle some of the most common ones we hear from people setting up or fine-tuning their SEO dashboards.
For most businesses, a weekly check-in is the sweet spot. It's frequent enough to spot new trends, see how your campaigns are doing, and catch any major problems before they spiral, all without getting bogged down in the tiny, meaningless daily fluctuations.
Of course, some situations call for a closer eye. You’ll want to switch to daily check-ins during:
The real key isn't a magic number—it's consistency. When you look at your dashboard regularly, you get a real feel for your data's normal rhythm, making it a thousand times easier to spot when something’s off.
Yes, absolutely. You can build an incredibly useful and effective SEO performance dashboard without spending a dime. The go-to tool for this is Google Looker Studio (which used to be called Data Studio), and it’s completely free.
By hooking it up to Google Analytics and Google Search Console—which are also free—you can create a seriously robust dashboard. It will track your visibility, traffic, user engagement, and even basic conversions. While paid tools definitely offer more advanced features, a free setup gives you more than enough firepower to guide a successful SEO strategy.
The easiest way to think about it is that one is alive and the other is a snapshot in time.
Ready to turn your dashboard from a reactive report into a proactive command center? IndexPilot provides the real-time indexing insights you need to ensure your content is always visible on Google. Start your free 14-day trial and see what you've been missing. Get started with IndexPilot today!